SIOS SANless clusters

SIOS SANless clusters High-availability Machine Learning monitoring

  • Home
  • Products
    • SIOS DataKeeper for Windows
    • SIOS Protection Suite for Linux
  • News and Events
  • Clustering Simplified
  • Success Stories
  • Contact Us
  • English
  • 中文 (中国)
  • 中文 (台灣)
  • 한국어
  • Bahasa Indonesia
  • ไทย

About Using Amazon FSX for SQL Server Failover Cluster Instance

February 14, 2021 by Jason Aw Leave a Comment

About Using Amazon FSX for SQL Server Failover Cluster Instance

Using Amazon FSX for SQL Server Failover Cluster Instance – What You Need To Know!

If you are considering deploying your own Microsoft SQL Server instances in AWS EC2, you have some decisions to make regarding the resiliency of the solution. Sure, AWS will offer you a 99.99% SLA on your Compute resources if you deploy two or more instances across different availability zones. But don’t be fooled, there are a lot of other factors you need to consider when calculating your true application availability. I recently blogged about how to calculate your application availability in the cloud. You probably should have a quick read of that article before you move on.

When it comes to ensuring your Microsoft SQL Server instance is highly available, it really comes down to two basic choices: Always On Availability Group (AG) or SQL Server Failover Cluster Instance (FCI). If you are reading this article I’m making an assumption you are well aware of both of these options and are seriously considering using a SQL Server Failover Cluster Instance instead of a SQL Server Always On AG.

Benefits Of A Microsoft SQL Server Failover Cluster Instance

The following list summarize what AWS says are the benefits of a SQL Server FCI:

FCI is generally preferable over AG for SQL Server high availability deployments when the following are priority concerns for your use case:

License cost efficiency: You need the Enterprise Edition license of SQL Server to run AGs, whereas you only need the Standard Edition license to run FCIs. This is typically 50–60% less expensive than the Enterprise Edition. Although you can run a Basic version of AGs on Standard Edition starting from SQL Server 2016, it carries the limitation of supporting only one database per AG. This can become a challenge when dealing with applications that require multiple databases like SharePoint.

Instance-level protection versus database-level protection: With FCI, the entire instance is protected – if the primary node becomes unavailable, the entire instance is moved to the standby node. This takes care of the SQL Server logins, SQL Server Agent jobs, certificates, etc. that are stored in the system databases, which are physically stored in shared storage. With AG, on the other hand, only the databases in the group are protected, and system databases cannot be added to an AG – only user databases are allowed. It is the database administrator’s responsibility to replicate changes to system objects on all AG replicas. This leaves the possibility of human error causing the database to become inaccessible to the application.

DTC feature support: If you’re using SQL Server 2012 or 2014, and your application uses Distributed Transaction Coordinator (DTC), you are not able to use an AG as it is not supported. Use FCI in this situation.

https://aws.amazon.com/blogs/storage/simplify-your-microsoft-sql-server-high-availability-deployments-using-amazon-fsx-for-windows-file-server/

Challenges With FCI In The Cloud

Of course. The challenge with building an FCI that spans availability zones is the lack of a shared storage device that is normally required. Because the nodes of the cluster are distributed across multiple datacenters, a traditional SAN is not a viable option for shared storage. That leaves us with a two choices for cluster storage: 3rd party storage class resources like SIOS DataKeeper or the new Amazon FSx.

Let’s take a look at what you need to know before you make your choice.

SERVICE LEVEL AGREEMENT

As I wrote in how to calculate your application availability, your overall application SLA is only as good as your weakest link. In this case, the FSx SLA of 99.9%.

Normally 99.99% availability represents the starting point of what is considered “highly available”. This is what AWS promises you for your compute resources when two or more are deployed in different availability zones.

In case you didn’t know the difference between three nines and four nines…

  • 99.9% availability allows for 43.83 minutes of downtime per month
  • 99.99% availability allows for only 4.38 minutes of downtime per month

By hosting your cluster storage on FSx despite your 99.99% compute availability, your overall application availability will be 99.9%. In contrast, EBS volumes that span availability zones, such as in a DataKeeper deployment, qualifies for the 99.99% SLA at both the storage and compute layers. This means your overall application availability is 99.99%.

STORAGE LOCATION

When configuring FSx for high availability, you will want to enable multi-AZ support. By enabling multi-AZ you have an effectively have a “preferred” AZ and a “standby” AZ. When you deploy your SQL Server FCI nodes you will want to distribute those nodes across the same AZs.

Now in normal situations, you will want to make sure the active cluster node resides in the same AZ as the preferred FSx storage node. This is to minimize the distance and latency to your storage. But also to minimize the costs associated with data transfer across AZs. As specified in the FSx price guide, “Standard data transfer fees apply for inter-AZ or inter-region access to file systems.”

In the unfortunate circumstance where you have a SQL Server FCI failure, but not a FSx failure, there is no mechanism to tie both the storage and compute together. In the event that FSx fails over, it will automatically fail back to the primary availability zone. However, best practices dictate SQL FCI remain running on the secondary node until root cause analysis is performed and fail back is typically scheduled to occur during maintenance periods. This leaves you in a situation where your storage resides in a different AZ, which will incur additional costs. Currently the cost for transferring data across AZs, both ingress and egress, is $0.01/GB.

Without keeping a close eye on the state of your FSx and SQL Server FCI, you may not even be aware that they are running in different regions until you see the data transfer charge at the end of the month.

In contrast, in a configuration that use SIOS DataKeeper, the storage failover is part of the SQL Server FCI recovery, ensuring that the storage always fails over with the SQL Server instance. This ensures SQL Server is always reading and writing to the EBS volumes that are directly attached to the active node. Keep in mind, DataKeeper will incur a data transfer cost associated with write operations which are replicated between AZs or regions. This data transfer cost can be minimized with the use of compression available in DataKeeper.

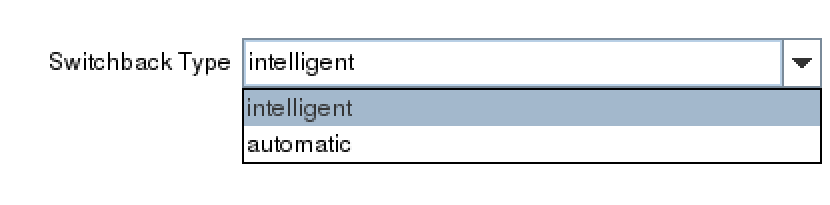
CONTROLLING FAILOVER

In an FSx multi-subnet configuration, there is a preferred availability zone and a standby availability. Should the FSx file server in the preferred availability zone experience a failure, the file server in the standby AZ will recover. AWS reports that this recovery time takes about 30 seconds with standard shares. With the use of continuously available file shares, Microsoft reports this failover time can be closer to 15 seconds. During this failover time, there is a brownout that occurs where reads and writes are paused, but will continue once recovery completes.

FSx multi-site has automatic failback enabled. This means that for every unplanned failover of FSx, you also have an unplanned failback. In contrast, typically when a SQL Server FCI experience an unplanned failover you would either just leave it running on the secondary or schedule a failback after hours or during the next maintenance period.

SQL SERVER ANALYSIS SERVICES CLUSTER NOT SUPPORTED WITH FSX

If you want to cluster SSAS, you will need a clustered disk resource like SIOS DataKeeper. The How to Cluster SQL Server Analysis Server white paper clearly states that SMB cannot be used and that cluster drives with drive letters must be used. In contrast, the DataKeeper Volume resource presents itself as a clustered disk and can be used with SSAS.

Summary

While FSx certainly can make sense for typical SMB uses like Windows user files and other non-critical services where 99.9% availability SLA suffices, FSx is an excellent option If you application requires high availability (99.99%) or HA/DR solutions that also span regions, the SIOS DataKeeper is the right fit.

Reproduced with permission from Clusteringformeremortals

Filed Under: Clustering Simplified Tagged With: Amazon FSX, SQL Server Failover Cluster Instance

SIOS Protection Suite for Linux Quick Service Protection

February 6, 2021 by Jason Aw Leave a Comment

How to add custom application support to SIOS Protection Suite - SIOS Protection Suite for Linux Quick Service Protection

Using SIOS Protection Suite for Linux Quick Service Protection Resource

On a recent engagement with the SIOS Professional Services team, a customer inquired about how to protect a custom application with the SIOS Protection Suite for Linux solution. One of the highly experienced high availability experts at SIOS Technology Corp., helped understand the customer’s application and laid out the methods SIOS provides for custom application support.

SIOS Protection Suite for Linux provides multiple methods for adding high availability and application monitoring to custom applications.  These options include the following:

  • Creating a custom application recovery kit (ARK)1
  • Creating a generic application resource hierarchy
  • Creating a quick service protection resource
Type Coding Complexity Monitoring Recovery
Custom Application Recovery Kit Resource1 Highest Highest Highest
Generic Application Resource Medium High High
Quick Service  Protection Resource Low Medium Medium

Definitions Used in Chart

Monitoring – defined as the ability to make a determination of the availability, accessibility and functioning of the protected application, database or service.  A low level of application, database, or service monitoring provides basic coverage, such as a check for a running process, existence of a pid_file, or that the status command returns a ‘true’ result when executed.  Note: A ‘true’ or ‘0 (zero)’ return code does not mean that the application, database, or service is running. But only that the command executed was able to successfully complete with a positive (‘true’ or ‘0 (zero)’) status result.  The highest level of monitoring indicates that application specific knowledge is applied to determine the health and functioning of the application beyond lower level methods such as process status, ps output, or systemd status returns.  The highest level of monitoring typically applies knowledge of recommended order of healthcheck operations, knowledge of dependencies, and analysis of the results obtained from status and monitoring commands.

Recovery – defined as the ability to restart a failed application, database or service.  A low level of recovery capability implies that commands for a restart are issued and expected output are obtained from the issuance of the command.  The highest level of monitoring indicates that application-specific knowledge is applied to determine how to initiate an orderly restart of the application, database, or service, which may require knowledge of recommended order of operations, dependencies, rollbacks or other related remediation of a failed service.

Solution:  Quick Service Protection Resource

In this engagement, the customer’s application had systemd compatibility. Based on their overall requirements for avoiding coding, minimal monitoring needs, and simple recovery procedures, we recommended the Quick Service Protection (QSP) Resource.

The QSP resource works to quickly add support of a systemd service to the SIOS Protection Suite for Linux resource protection.  In the case of Customer Example.com, they have a systemd compatible service, with the minimal required definition needed to start and stop their application.

[Unit]

Description=SIOS ‘as-is’ Example Service 2020

After=network.target

[Service]

Type=simple

Restart=always

RestartSec=3

User=root

ExecStart=/example_app/bin/exampleapp start

ExecStop=/example_app/bin/exampleapp stop

[Install]

WantedBy=multi-user.target

Example.com systemd file

SIOS recommends that prior to attempting the protection of the resource with the SIOS Protection Suite for Linux product, verify via systemctl that the example application stops and starts accordingly:

# systemctl status example

* example.service – SIOS ‘as-is’ Example Service 2020

Loaded: loaded (/usr/lib/systemd/system/example.service; disabled; vendor preset: disabled)

Active: inactive (dead)

# systemctl start example

# systemctl status example

* example.service – SIOS ‘as-is’ Example Service 2020

Loaded: loaded (/usr/lib/systemd/system/example.service; disabled; vendor preset: disabled)

Active: active (running) since Fri 2020-08-21 14:53:27 EDT; 5s ago

Main PID: 19937 (exampleapp)

CGroup: /system.slice/example.service

`-19937 /usr/bin/perl /example_app/bin/exampleapp start

# systemctl stop example

# systemctl status example

* example.service – SIOS ‘as-is’ Example Service 2020

Loaded: loaded (/usr/lib/systemd/system/example.service; disabled; vendor preset: disabled)

Active: inactive (dead)


After verifying that the application functions correctly via systemd, restart the service and ensure that the service is running.

# systemctl start example

# systemctl status example

* example.service – SIOS ‘as-is’ Example Service 2020

Loaded: loaded (/usr/lib/systemd/system/example.service; disabled; vendor preset: disabled)

Active: active (running) since Fri 2020-08-21 15:59:44 EDT; 3min 2s ago

Main PID: 30740 (exampleapp)

Refer to the SIOS Protection Suite for Linux Quick Service Protection Suite documentation for additional details on the resource create process.

Using the SPS-L UI select the Create option, indicated in the Global UI Resource Toolbar by the following icon:   SIOS Global US Resource

Once the create wizard is launched, select the Quick Service Protection option in the Create Resource Wizard Window


In the next prompt for  ‘Switchback Type’, choose whether you will use intelligent switchback or automatic switchback.

After selecting the ‘Switchback Type’,  the Server dialogue appears allowing you to choose the primary server for the custom application.


(Note: If the service requires storage, be sure to choose the same primary server previously selected for the storage resources.)

In the Service Name dialog box, find the service for your custom application.

Once you’ve selected the correct service, example, determine whether you will enable monitoring or disable the monitoring service.  Refer to the documentation to gain an understanding of the monitoring provided by the QSP resource.2


Next, choose a resource tag.  A resource tag should be a meaningful name that will help your IT team quickly identify which SPS-L resource protects your application or service.

Lastly, follow the final dialogue to complete the resource creation process.  Once the resource is created, use the UI to extend the resource to additional servers. If necessary, create dependencies between the newly protected custom service/application and any other required resources such as storage or IP resources.


NOTES:

1 Creating a customer application recovery kit can be accomplished via an engagement with the SIOS Technology Corp. Professional Services Team.  For more information contact professional-services@us.sios.com

2 The QSP Recovery Kit quickCheck can only perform simple health (using the “status” action of the service command). QSP doesn’t guarantee that the service is provided or the process is functioning. If complicated starting and/or stopping is necessary, or more robust health checking operations are necessary, using a Generic Application or Custom Application ARK is recommended

Reproduced from SIOS

Filed Under: Clustering Simplified Tagged With: Application availability, clusters, High Availability, high availability - SAP, SAP S/4HANA

How to Understand & Respond to Availability Alerts

January 29, 2021 by Jason Aw Leave a Comment

Understand & Respond to Availability Alerts

Houston We Have a Problem (or How to Understand & Respond to Availability Alerts)

A Successful Failure

Houston we have a problem!  It is an iconic line that reminds countless space buffs and movie fans about the great difficulty, potential disaster, and the perilous state of the Apollo 13 space mission – a mission NASA now calls “A Successful Failure.”  Ignoring your own application availability alerts may not go down in history as a defining moment, but can also wreak similar havoc

Now back to 1970:

“A routine stir of an oxygen tank ignited damaged wire insulation inside it, causing an explosion that vented the contents of both of the Service Module’s (SM) oxygen tanks to space. Without oxygen, needed for breathing and for generating electric power, the SM’s propulsion and life support systems could not operate. The Command Module’s (CM) systems had to be shut down to conserve its remaining resources for reentry, forcing the crew to transfer to the Lunar Module (LM) as a lifeboat. With the lunar landing canceled, mission controllers worked to bring the crew home alive.”

An explosion of oxygen tanks triggered alarms, warnings, pressure and voltage drops, interrupted communications, and then the now famous radio communication between the astronauts and Mission Control.  But what if, after the explosion, the crew did nothing? What if they never checked on the explosion, never responded to the warnings and gauges, and never informed Mission Control of there being an issue?  What if Mission Control, after being notified or alerted back at their dashboard in the control center, never attempted to provide any assistance?  What if the team buried their heads in the sand, or resigned themselves to fate and chance, never tried to learn, improvise, or improve from the failure they encountered?  The result would have been tragic!  It may have made it to a documentary, but hardly a blockbuster movie featuring an iconic line.

What Do You Do When an Alert is Triggered in Your Environment?

Space walks are a far cry from our own day to day activities, unless of course you work for NASA, but recent blogs on Apollo 13 do spark a question applicable to availability.  What do you do when there is an alert triggered in your environment? Do you just ignore it?  Do you downplay it, waiting to see if the alerts, log messages, or other indicators will just go away?  Do you contact your vendor support to understand how you can disable these alerts, warnings, and messages?  Or do you say, “We have a problem here and we need to work it out”?

As a VP of Customer Experience at SIOS Technology Corp. we have experienced both sides of alerts and indicators.  We have painstakingly walked with customers who chose to ignore warnings, turning off critical alerts that indicated issues, ranging from application thresholds to network instability to potential data inconsistency.  And we have also seen customers who have tuned into their alerts, investigated why their alarms were going off, uncovered the root cause and enjoyed the fruit of their labor.  This fruit is most often the sweet reward of improved stability, innovation and learning, or an averted disaster.

4 things you can do when you your availability product triggers an alert

1. Determine if the type and criticality of the availability alert.

Is the alert or error indicative of a warning, an error, or a critical issue? A good place to assist you and your team with understanding criticality is to consult with available documentation. Check the product documentation, online forums, knowledge base articles (KBA), and internal team data and process manuals.

2. Assess the immediacy of the alert. 

For warnings and errors, how likely are they to progress into a critical issue or event.  For critical issues and alerts, this may be obvious but an assessment, even of critical events will provide some guidance on your next steps; self-correction, issue isolation, or immediate escalation.

3. Consult additional sources. 

What other sources can you access to make a determination about the alert condition? For example, if the alert is storage related, are there other tools that can expose the health of your storage?  If the issue is a network alert, are there hypervisor tools, traffic tools, NIC statistics, or other specialized monitoring tools deployed to help with analysis.

4. Contact support.

In other words, if you are unsure, alert Mission Control. After determining the type, assessing the immediacy, and consulting additional sources, it is a good idea to contact your vendor for support.  A warning about a threshold for API calls may seem innocent. But if the API calls will fail once such a limit is reached, this could be cause for immediate action. Getting the authority of the specialist can be helpful in keeping peace of mind and avoiding disaster.

An experienced vendor like SIOS can help you quickly identify the causes of problems and recommend the best solution.

Repeatedly ignoring problems in your availability environment can lead to unexpected, but no less devastating results. Addressing the problems indicated by alerts, log messages, warning indicators, or other installed and configured indicators gives your customers, your business, your teams, and yourself the “opportunity to solve the problems,” before it becomes a disaster. And at the same time, strengthens your availability strategy and infrastructure.  Which will you choose?

–  Cassius Rhue, VP, Customer Experience

Reproduced from SIOS

Filed Under: Clustering Simplified Tagged With: Application availability, application monitoring, disaster recovery, High Availability, high availability - SAP, SQL Server High Availability

Do I Even Need High Availability software in the Cloud?

January 23, 2021 by Jason Aw Leave a Comment

Do I Even Need High Availability software in the Cloud?

Do I Even Need High Availability software in the Cloud?

Allow me to jog your memory . . .

Maybe today you haven’t had a failure in a dozen or more months and suddenly the slam dunk renewal for your high availability software licenses is under the redline of the CFO’s pen.  Or perhaps, due in part to the overuse of the term, clever marketing, or the redefinition of high availability your CIO, once the most die-hard availability fan, has begun to waver on its value.  Or maybe, just maybe it’s not the CFO or the CIO, but you who decided that you might have enough HA without needing high or higher availability software in the equation.

While the public cloud is incredibly resilient and availability has been considered at many turns, the need for stable, maintainable high availability software is still a present reality.  Consider 2020 for example, advances in public cloud computing and availability have still been unable to prevent common mishaps such as bad practice and bad code causing an application crash, undisclosed data center failures, nameless construction snafus affecting power or networking, capacity overload on a VM, or cooling system failures as noted by one CRN article.

Here are seven reasons you still need higher availability software in the Cloud: 

1. For increased depth and breadth of application coverage for your most critical enterprise applications

No single Cloud vendor will have all the tools, software, and applications you need baked into their cloud infrastructure in a way that your enterprise can consume.  Because of this, you will likely migrate workloads to the cloud into IaaS offerings that require someone or something to protect these workloads and make sure they are highly available.

2. For automated and intelligent application recovery of systems, resources and their dependencies.

Cloud vendors know about clouds. High availability vendors know about application high availability. When, not if, a failure happens in the cloud your application needs intelligent recovery of the failed components; systems, application resources, infrastructure components and their dependencies.  As an expert in availability, your software vendor has a breadth of knowledge baked into the application protection. In the SIOS Protection Suite for Linux product, wizard based automation using industry best practices, and a long history of application expertise drive clear automated recovery of applications in a failure scenario

3. For intelligent block level data replication for your application, increasing your resilience in the event of a system panic or datacenter outage

Application coverage and smart, balanced recovery is made possible when the data is available on the standby system in the event of a failure.  When your HA vendor includes block level data replication, you are able to expand the failover resilience of your application beyond a single datacenter or region into multiple datacenters and regions.  Block level data replication is also an effective way to avoid hardware values that impact cloud volumes in a single data center.  One cloud incident involving a datacenter power and subsequent generator failure resulted in hardware damage and data loss for instances running in the single data center.  Cloud does not mean that you are completely safe from all failures, and backups as well as highly available data replication copies is a must.

4. For a faster response mechanism for problem detection and resolution

Your HA software is the first line of defense for identifying and remediating application failures.  With monitoring daemons, an application failure can be quickly detected and remediated by the software before users are critically impacted.  In addition, your high availability software such as the SIOS Protection Suite for Linux solution includes configurable methods for sending and communicating alerts to administrators, event consoles, or dashboards which allows you to instantly and effectively communicate with key  .

5. For an additional source of data that can be mined and audited to help predict the health and stability of your enterprise

Data is king.  Your high availability software is a tremendous source of data and information about your environment that can be mined and audited.  As your HA solution responds to application failures, infrastructure issues and latencies, and drives your uptime through transient failures their logs capture critical information on the health of your enterprise.  As VP of Customer Experience, our Customer Success and Support team was able to use our HA logs to provide a health check up to a customer, informing them of several application issues and optimizations possible because of the captured log data.

6. For the balanced and truthful viewpoint, and supplemental wisdom needed for your enterprise

In addition to the value of the High Availability software, there is another reason why you still need HA software in the cloud.  That additional reason is the balanced and truthful viewpoint and supplemental wisdom of your HA vendor’s development, services and customer experience teams.  Your HA software is supported by a team of experts, experienced availability engineers, and most importantly a services and support team with years of best practice experience, application specific knowledge, and cross pollinated ideas and skills that can greatly benefit your enterprise.

7. For reduced planned maintenance downtime

Last but not least, your higher availability software helps reduce or possibly eliminate the downtime required for upgrades, minor patches, and rolling preventative maintenance.  Utilizing your HA software’s switchover and failover capabilities, your standby server can be actively patched, updated, and tested then promoted to being the active availability node.  Thereby ensuring that your critical systems are running on the latest releases while minimizing the penalty of upgrades.

Yes, the Cloud has added increased hardware and platform stability for applications, developers, and enterprise users, but if you’ve begun thinking that you don’t need high availability you are heading down a dark alley that ends in the despair of a late night of cold pizza putting applications back online, explaining the unexplainable, and contemplating dusting off resumes.  So thanks for letting me jog your memory . . .  You and your HA software need each other, even in the Cloud.

– Cassius Rhue, Vice President, Customer Experience

Reproduced with permission from SIOS


Filed Under: Clustering Simplified Tagged With: Amazon AWS, Amazon EC2, Cloud, cloud migration

Should I Still Use Zabbix In AWS?

January 16, 2021 by Jason Aw Leave a Comment

Should I Still Use Zabbix In AWS

Should I Still Use Zabbix In AWS?

Amazon EC2 monitoring

For mission-critical applications, ERPs, and databases, such as SQL Server, SAP, HANA, and Oracle your application monitoring needs are best served by a clustering software like SIOS Protection Suite that monitors the full application stack (on-premises or in the cloud). If it detects an application issue, it orchestrates the failover of application operation to a standby node automatically.

However, for applications that don’t require high availability clustering, Zabbix has a high market share as an integrated OSS monitoring tool.  Although it has been widely used in on-premise environments, there are many examples of Zabbix being used in AWS environments.  In spite of the fact that AWS also has monitoring services such as Amazon CloudWatch, why should you use Zabbix?  This section explains the benefits of monitoring EC2 instances and other instances, as well as the configuration process.

Why use Zabbix instead of Amazon CloudWatch?

In an AWS environment, all of the infrastructure is operated by AWS, but you must be responsible for the operation of the Amazon EC2 instances themselves and the applications built on Amazon EC2. In other words, you must monitor the applications to ensure that they are operating properly, and you must take action when a problem occurs.  For non-mission-critical applications, Zabbix is a good candidate for this kind of monitoring tool.

Zabbix has the advantage of being able to monitor not only on-premises, but also cloud and virtual environments in an integrated manner.

Whereas the standard Amazon CloudWatch is limited to monitoring AWS resources (CPU, memory, etc.), Zabbix allows you to monitor even the state of your applications in detail. The following is a list of other advantages of Zabbix.

Integrated monitoring of environments with multiple AWS accounts

Amazon CloudWatch performs monitoring on a per AWS account basis.  Zabbix can monitor an environment of multiple AWS accounts, that can be monitoring business systems consisting of multiple accounts.  It can also detect anomalies not only by simple alerts based on thresholds, but also by multiple thresholds and conditions in combination. 

It can be configured Detailed notifications to suit the actual conditions of operation

Amazon CloudWatch can notify you with a message in the event of an anomaly.  For example, if your system is down for maintenance, you don’t need to be notified by message.  This is where Zabbix allows you to configure these cases in a way that allows you to suppress unwanted messages.  This way you can ensure that you are only notified when something is really wrong that needs to be addressed.

No retention period for metrics (monitoring log)

With Amazon CloudWatch, metrics can be stored for up to 15 months.  Moreover, you can only store metrics in hourly increments for 15 months, and if the monitoring interval is set to less than 60 seconds, you can only store them for a maximum of 3 hours.  Zabbix allows for long-term storage of metrics without changing the granularity of information.

How to monitor AWS environment with Zabbix

If you want to use Zabbix in an AWS, you will need to create an Amazon EC2 and DB instance and install Zabbix on it.  After installation, the process of configuring Zabbix is basically the same as on-premise, except that you will need to set up the following

  1. User account (in addition to the Admin user of Zabbix, you will need to create a user for production use)
  2. Zabbix host agent (determines where the data is collected from)
  3. Items (setting what data to collect)
  4. Triggers (defining what state the data is in that is abnormal)
  5. Actions (defining the actions to be taken when an error occurs)

In addition, you can configure AWS-specific settings, such as creating a user in AWS IAM with the necessary permissions for Zabbix, which will allow Zabbix to monitor applications and other aspects of your AWS environment.

Use the right tool for your monitoring needs

Not all corporate systems operate in isolation, but many systems are linked together to exchange data and ensure consistency as a whole.  In these environments, Zabbix is a great tool for monitoring and detecting anomalies across multiple servers and systems.  For example, if a DB-based web application has an anomaly on the web application server, it is possible to disable the data, for example.

On the other hand, Zabbix has a lot of configuration options, so you will have to decide what to monitor and how, and what conditions are abnormal.

On the other hand, Zabbix has a lot of settings, so you have to design the operation exactly what to monitor and what to do about it, and what to do about it. Of course, for critical systems such a design is essential, however, for relatively simple systems, such as “if a process stops, just restart it”, there is no match for Zabbix monitoring.

For mission-critical applications, SIOS Protection Suite includes application recovery kits that provide application-specific monitoring of the entire application environment, server, storage and network as well as failover orchestration according to application-specific best practices on Amazon EC2.

Don’t trust your application availability and monitoring to just anyone.  Get in touch with the availability experts at SIOS to see how we can help you.

Reproduced from SIOS

Filed Under: Clustering Simplified Tagged With: Application availability, application monitoring, Zabbix

  • « Previous Page
  • 1
  • …
  • 61
  • 62
  • 63
  • 64
  • 65
  • …
  • 104
  • Next Page »

Recent Posts

  • Transitioning from VMware to Nutanix
  • Are my servers disposable? How High Availability software fits in cloud best practices
  • Data Recovery Strategies for a Disaster-Prone World
  • DataKeeper and Baseball: A Strategic Take on Disaster Recovery
  • Budgeting for SQL Server Downtime Risk

Most Popular Posts

Maximise replication performance for Linux Clustering with Fusion-io
Failover Clustering with VMware High Availability
create A 2-Node MySQL Cluster Without Shared Storage
SAP for High Availability Solutions For Linux
Bandwidth To Support Real-Time Replication
The Availability Equation – High Availability Solutions.jpg
Choosing Platforms To Replicate Data - Host-Based Or Storage-Based?
Guide To Connect To An iSCSI Target Using Open-iSCSI Initiator Software
Best Practices to Eliminate SPoF In Cluster Architecture
Step-By-Step How To Configure A Linux Failover Cluster In Microsoft Azure IaaS Without Shared Storage azure sanless
Take Action Before SQL Server 20082008 R2 Support Expires
How To Cluster MaxDB On Windows In The Cloud

Join Our Mailing List

Copyright © 2025 · Enterprise Pro Theme on Genesis Framework · WordPress · Log in